

February 15, 2023
Many investors will look at historical returns to determine what may be a profitable investment for the future. This could be choosing a stock, fund, or sector of the market to invest in. When looking at historical data, it can be easy to chase returns without capturing gains.
2022 vs One Month of 2023
So far in 2023, the performance of the broad U.S. stock market has looked much different than what investors faced throughout 2022. In January, the Russell 3000® Index returned nearly 7%, compared to a nearly 20% loss last year.
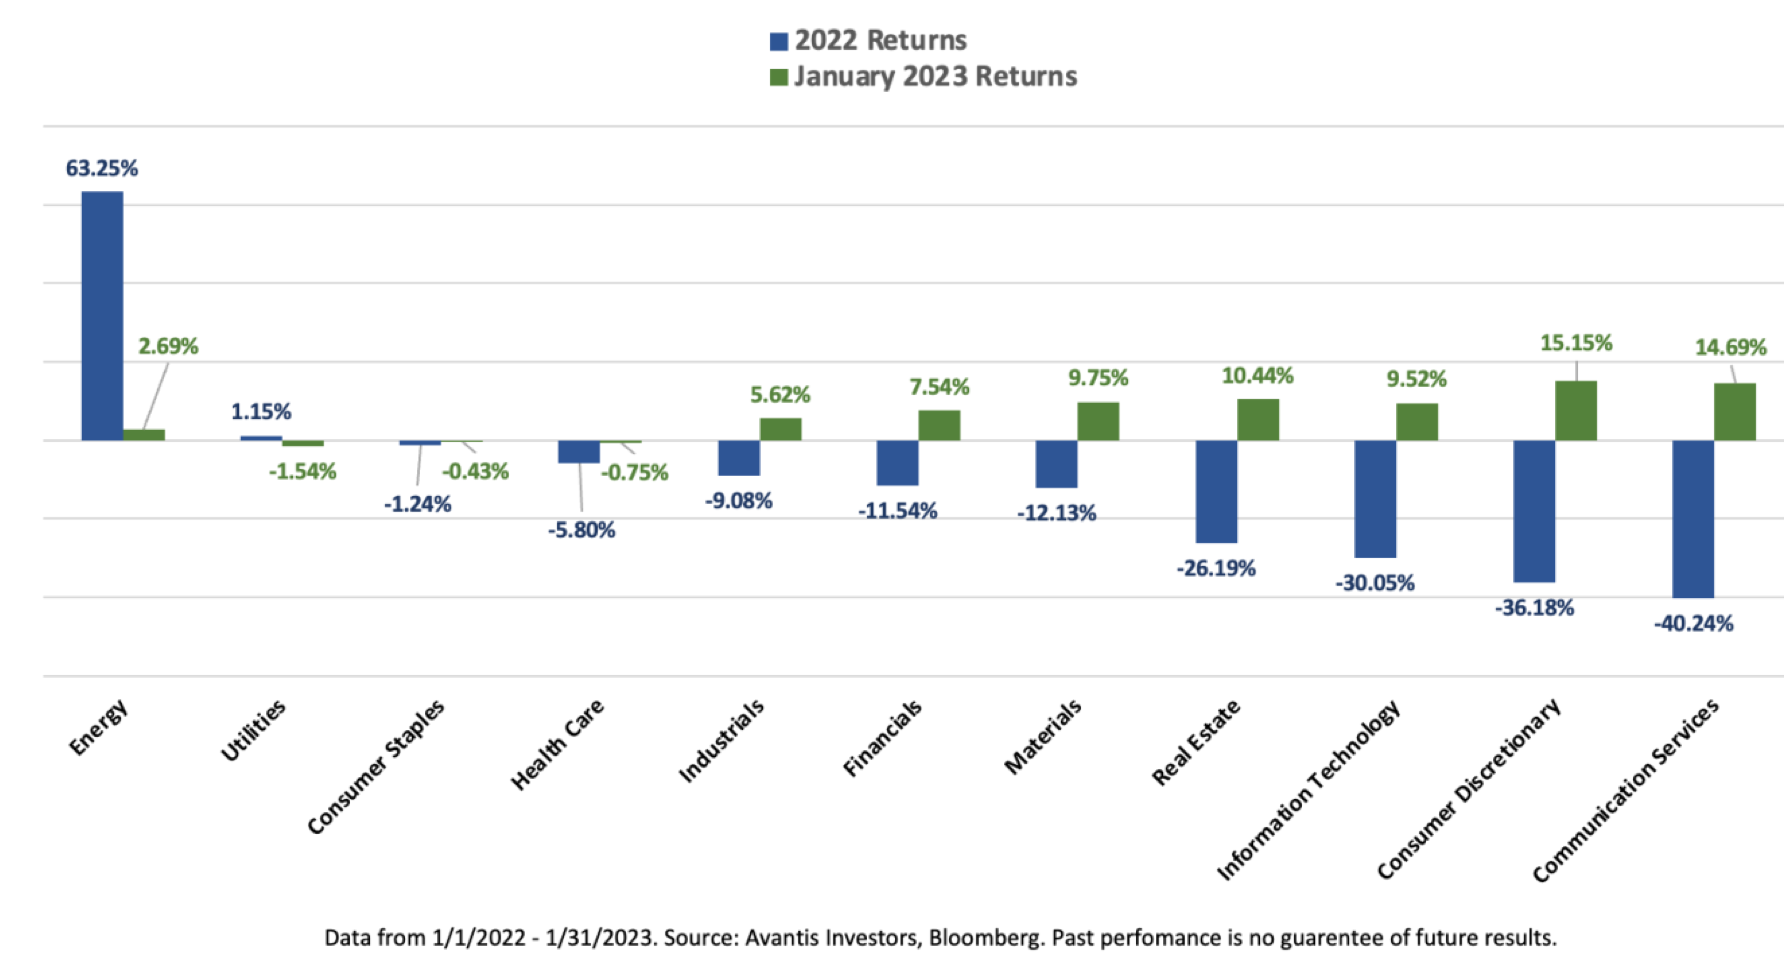
If we look a little deeper into the sector components of the index, we find that the sectors leading the way this year are quite different than the best performers in 2022. In Figure 1 below, we can see that energy far and away led the pack as one of only two sectors with positive returns in 2022 by delivering more than 60% for the year. In 2023, however, energy is near the bottom of the pack and below the total market return year to date. Conversely, the two worst-performing sectors of 2022, consumer services and consumer discretionary, were the best-performing sectors in January.
Figure 1. U.S. Sector Returns in Calendar Year 2022 vs. January 2023
Some investors may view this as the start of a new cycle where good times have begun for sectors that previously faced headwinds. History gives us reason to believe caution is warranted.
A Deeper Dive into Sector Performance 2022
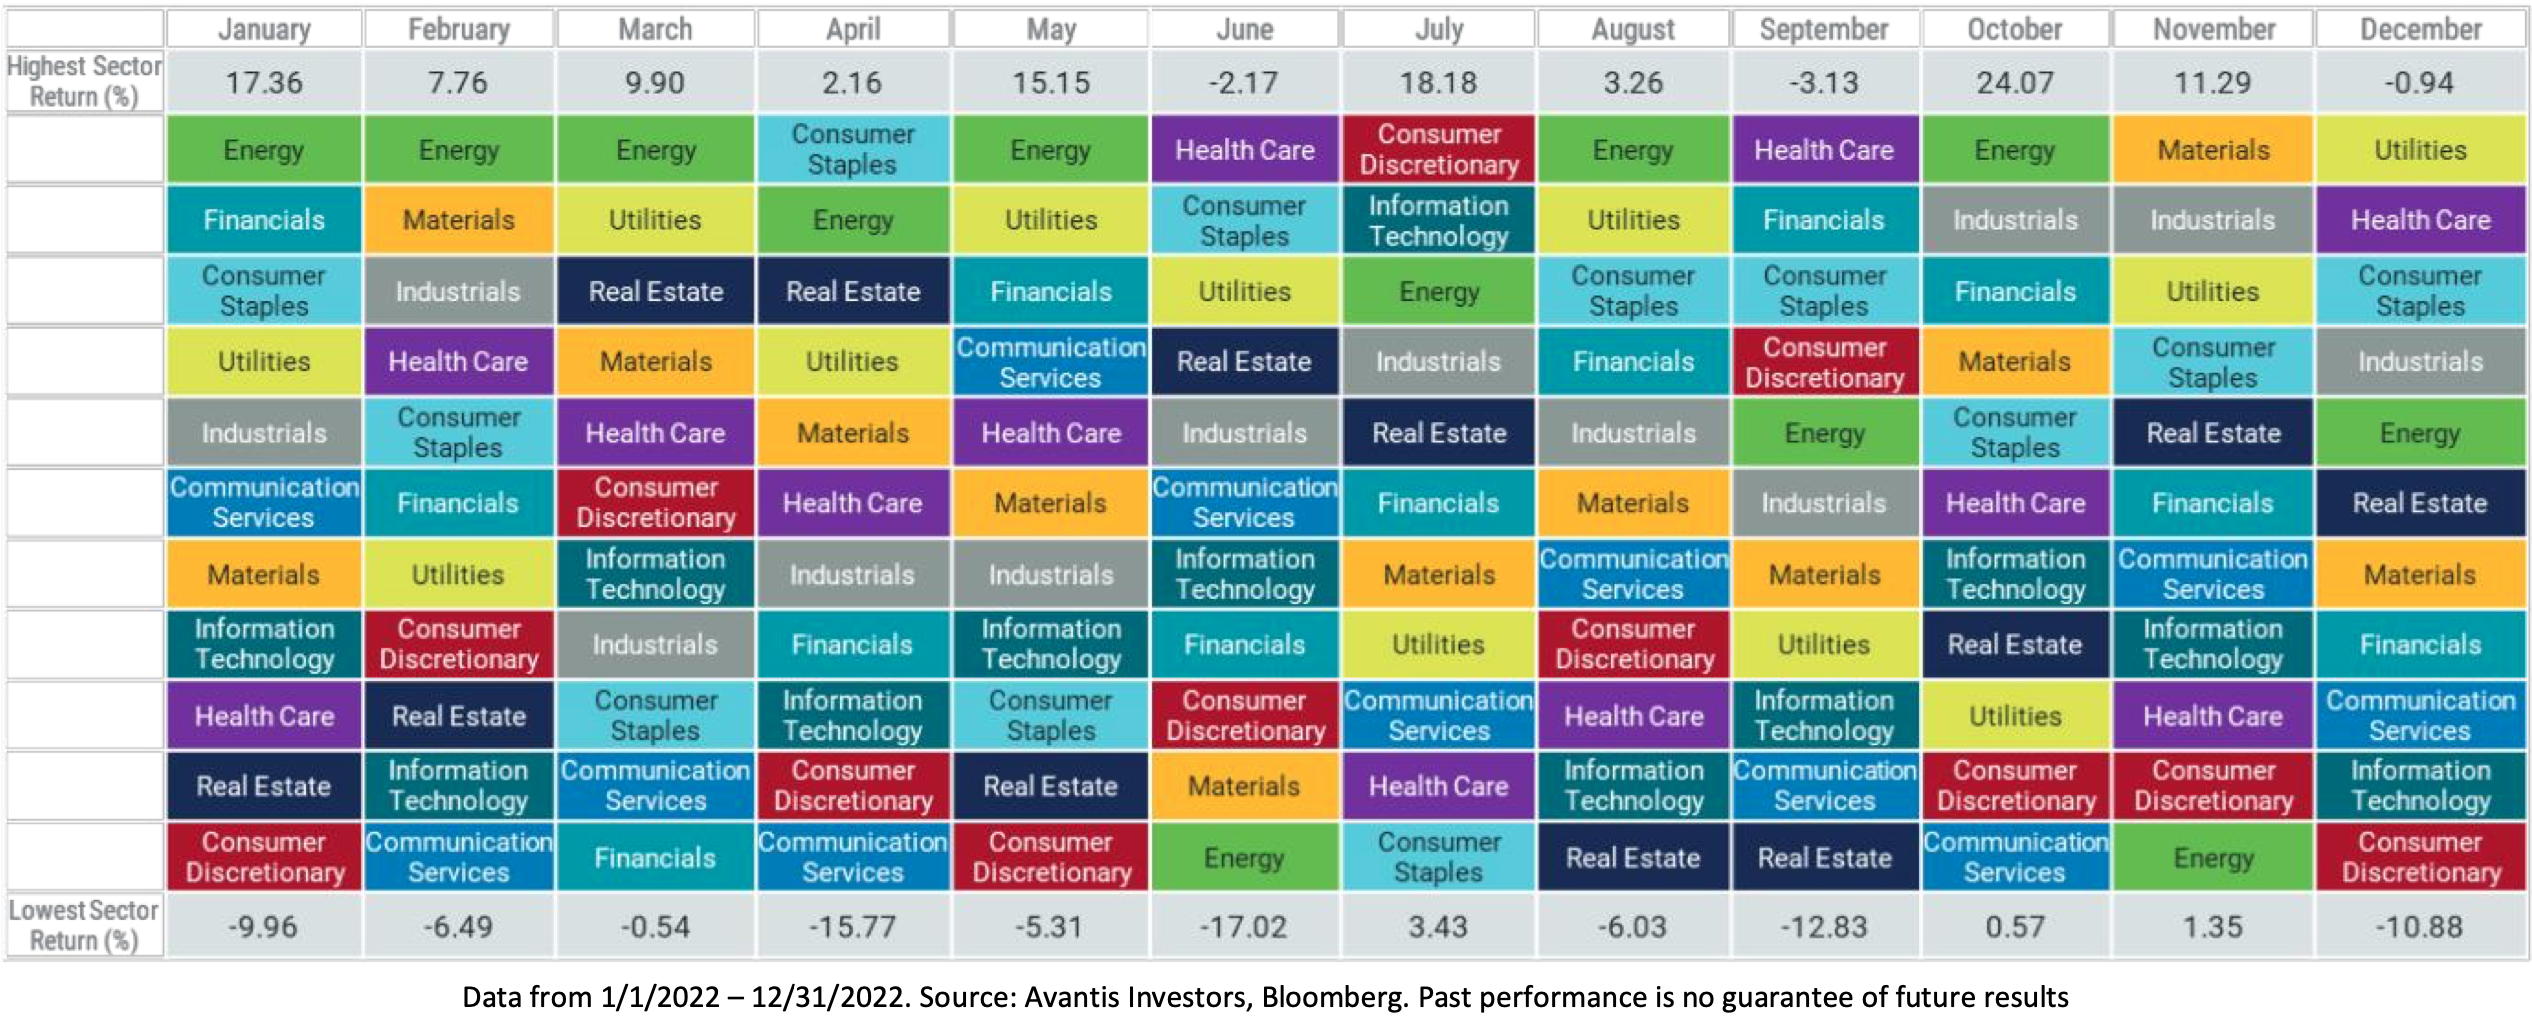
In Figure 2, we show how sectors performed during each month of 2022, ranked from best to worst. Both the magnitude of return differences between sectors each month and the variability in sector returns from month to month may surprise some investors. For example, the average difference in returns between the top- and bottom-performing sectors was more than 15%, and the largest month-to-month difference for an individual sector was with energy, with a whopping swing of about 32% (up over 15% in May but then retreating by 17% in June).
We can see additional insights using the high-flying energy sector. While energy stocks offered the highest return in six out of 12 months, the sector’s June return of -17% was the worst single-month return of all sectors throughout the year.
Investors who saw the outsized returns in energy from January through May and chose to invest in the sector at the start of June would have earned less than 4% over the final seven months of the year. This compares to the more than 63% return the energy sector delivered over the entire year.
Figure 2. Monthly U.S. Sector Return Rankings for 2022
While the nearly 4% return to energy stocks was still the best return of all sectors over those final seven months of the year, that would have required those investors to stay invested through a highly volatile period. After four months of holding energy stocks, they would have been down more than 14% while lagging six other sectors.
This example shines a light on the fact that when concentrating on a single sector with the goal of beating the market, you must first pick correctly and then also have the conviction to stick with it through the ups and downs.
Sector Performance over a Longer Period
One month in 2023 and even the year of 2022 do not make for long-term trends. Figure 3 offers a longer-term perspective, presenting annual sector performance ranked from best to worst over the last 10 calendar years and for the full 10-year period. Again, the variability in sector returns is clear. Over these 10 years, six of the 12 sectors were the highest performing sector at least once, with a sector repeating itself as the leader in consecutive years only once. Five were the worst-performing sectors in at least one year over the period.
Figure 3. U.S. Sector Return Rankings Over the Last 10 Years (2013-2022)
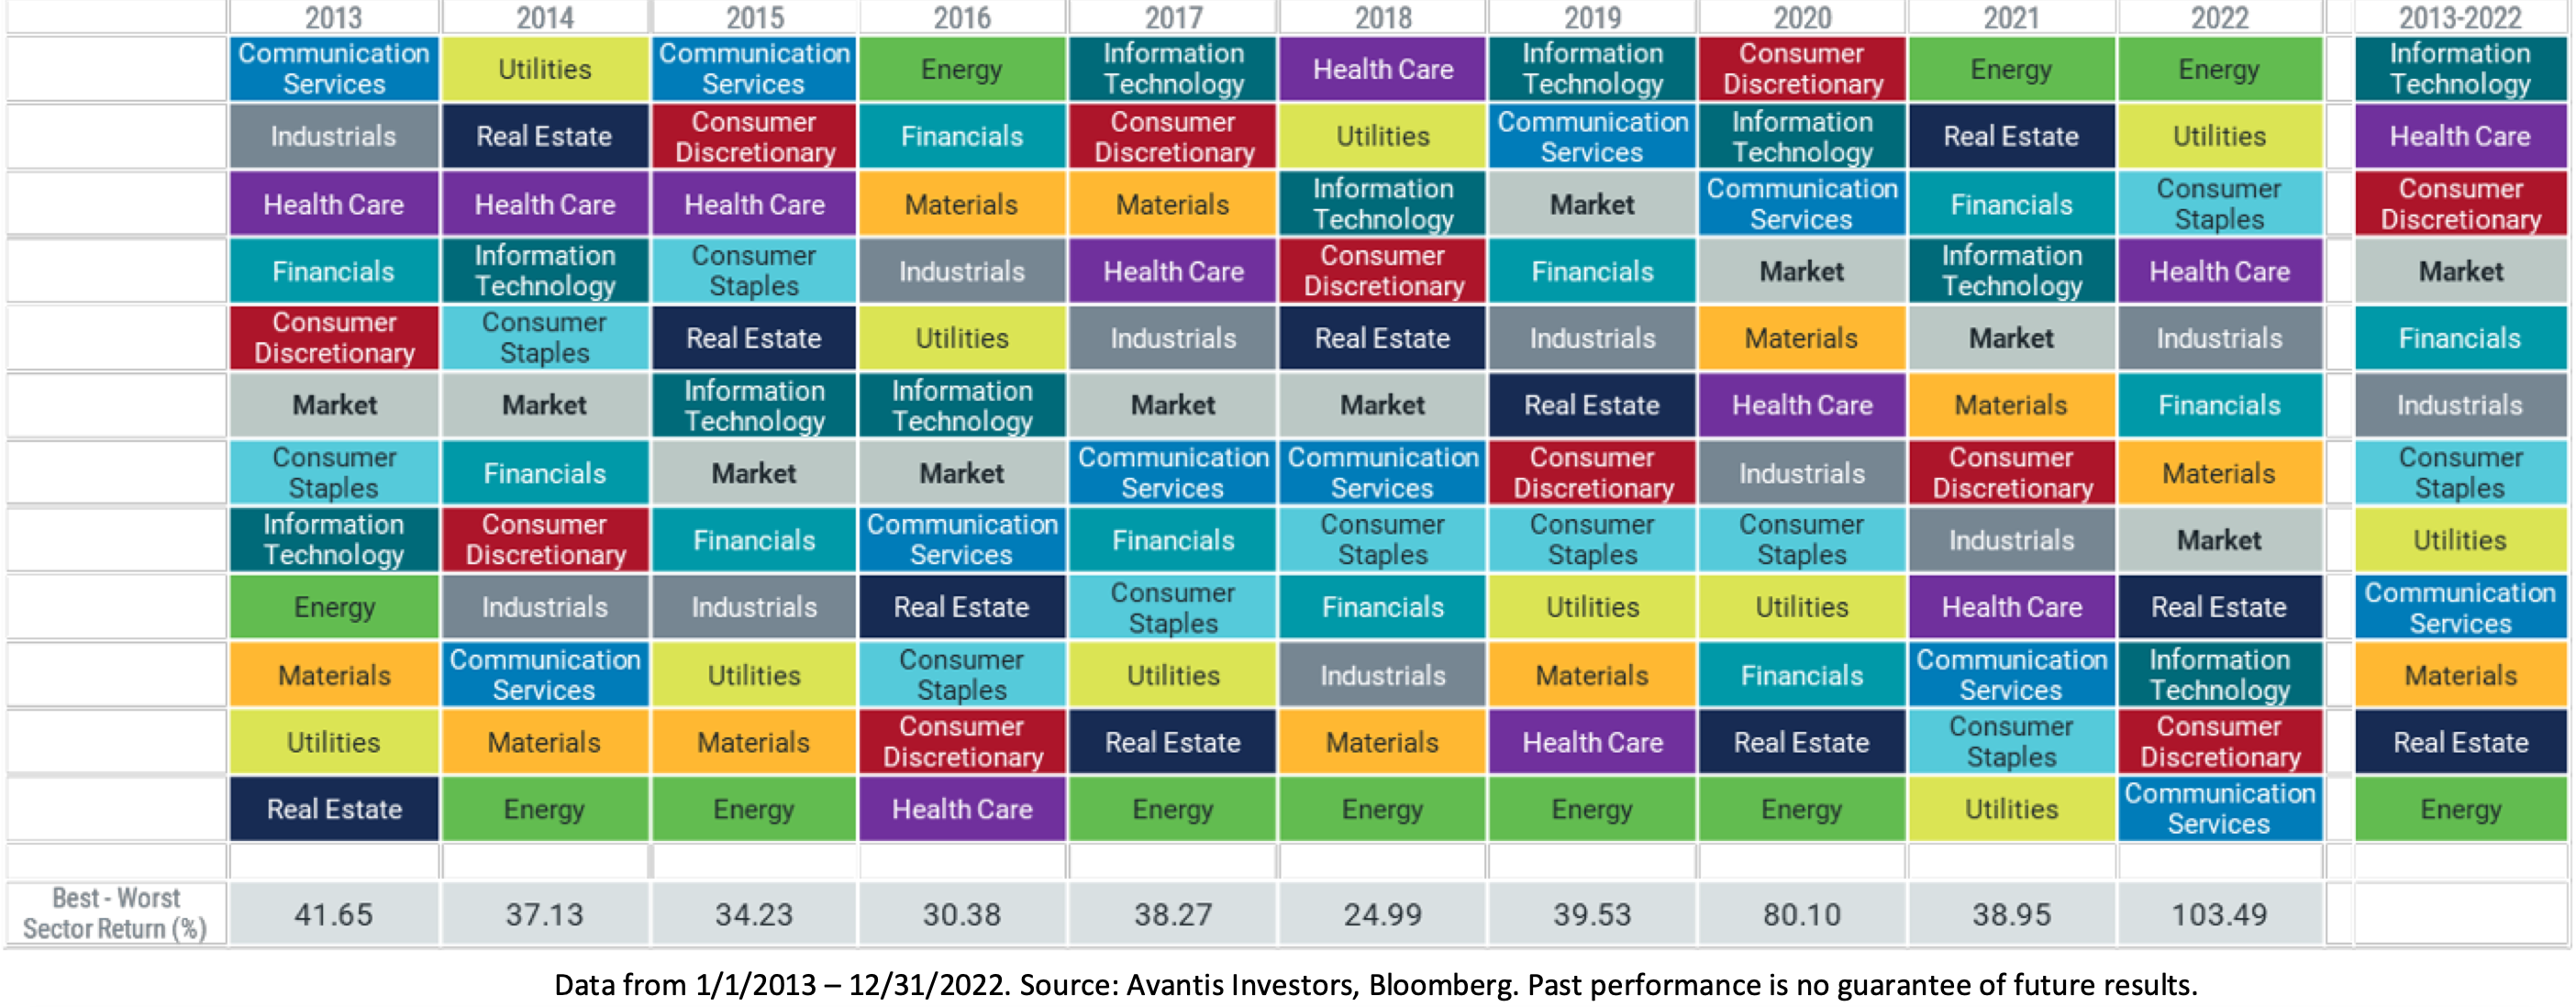
It almost looks like the best-performing sector each year is randomly selected. This makes choosing the right sector at the right time so difficult. Fortunately, investors don’t have to play the sector guessing game. Embracing broad diversification means that not every sector has to increase in value for your portfolio to earn a positive return in any single year or over the long term.
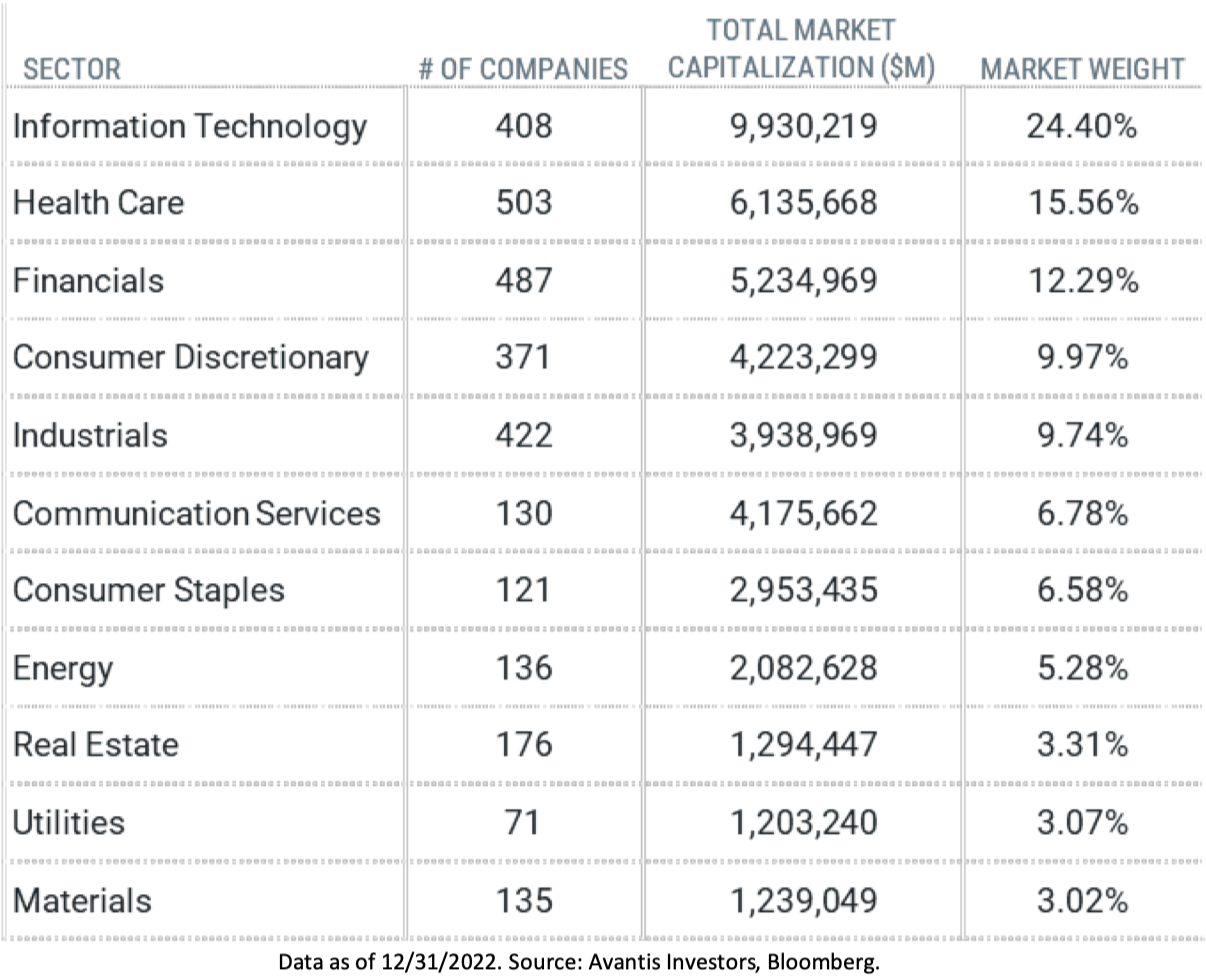
While Figures 1-3 above highlight the challenge of predicting which sectors will outperform, Figure 4 below highlights the broad exposure that investors may give up by heavily overweighting in a single sector.
Energy offers another good example. If an investor were to allocate his portfolio to just the energy sector, he would be missing out on almost 95% of the investible U.S. stock market. Even allocating to just the largest sector, information technology, would leave out three-quarters of the investible universe.
Figure 4. U.S. Sector Snapshot as of December 31, 2022
While it may be tempting to chase that top-performing sector or only hold what we perceive as “safe” investments during periods of volatility, we shouldn’t forget that the market is simply the sum of each sector and the companies that make it up — all with the opportunity to be that next top performer.
Conclusion
At Prato Capital, we feel it is important for our clients not to pick and choose what some may feel may be the next big winner in the stock market. Whether it is an individual stock, a sector of the market, or a previously high-flying ETF. We believe an important benefit to our clients who buy and hold diversified portfolios is knowing they’ll own the winners over any period. Over the long term, these investors have typically been rewarded.
“You must never delude yourself into thinking that you’re investing when you’re speculating” – Benjamin Graham
Gregory, Gabriella, Brian, Samer, and Chris Prato Capital Management Where Integrity Meets Discipline
