
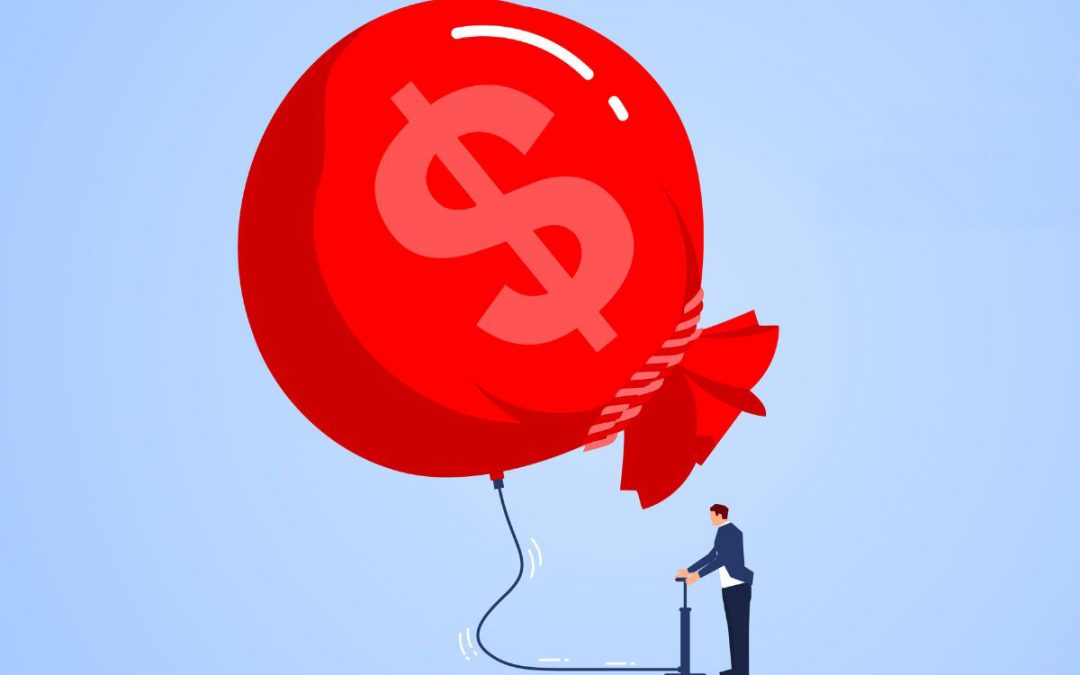
Inflation and its effects
The inflation rates recently released for October 2021 were higher than economists predicted and many in the financial media have predicted that the Federal Reserve may raise interest rates by mid-2022 now. Many analysts and market commentators are also saying that as interest rates rise, consumer spending will decrease and that will lead to lower earnings and ultimately lower stock prices. On the surface, it seems like a plausible conclusion, but do the assumptions in these statements hold up when we use history as a guide and look back at the last 50 years.
Using history as a guide
The following charts look closer at the past 50 years of inflation data, stock market returns and rising Federal Funds rates (the interest rate set by the Federal Reserve).
On all the charts below, the red line is the rate of consumer inflation, the blue line is the annual return of the Wilshire 5000 market index¹ with dividends reinvested, and the green line is the Federal Funds rate.²
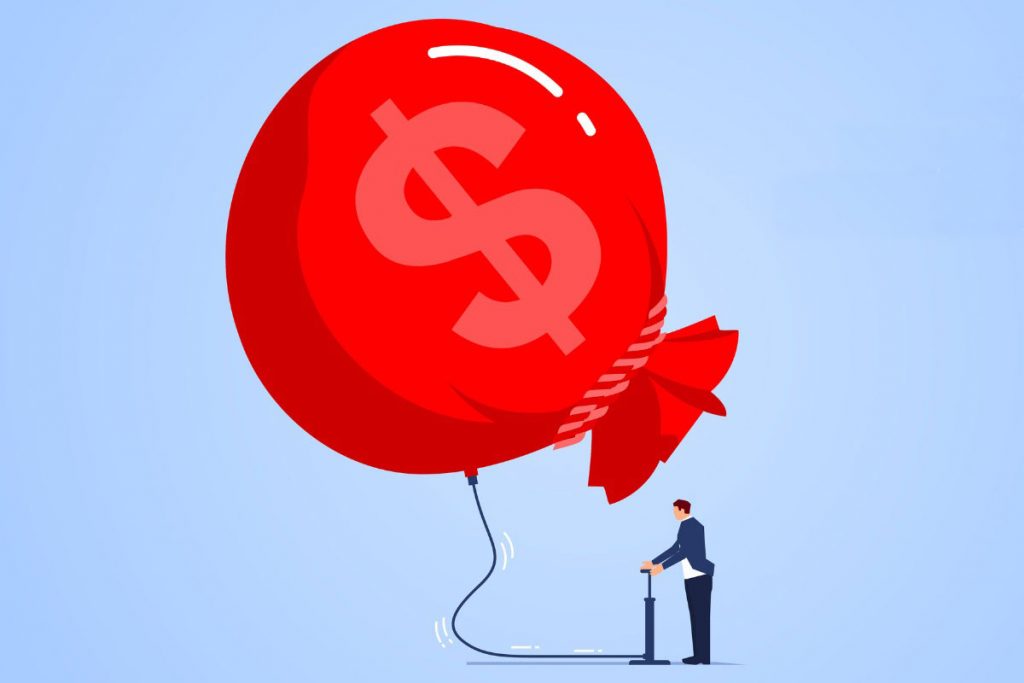
Chart 1: Annual Percentage Change of Consumer Prices and the US Stock Market, 1972 – 2021
The chart above shows that over the past 50 years, the broadest index of US stocks, the Wilshire 5000 annually outpaced inflation 76% of the time and by an average of 8.4%.
Of those few times that inflation was higher than stock market returns, most were during recessionary periods for the US economy shown by the gray shaded areas of the chart.
When inflation was over 5% in the past 50 years, the Wilshire 5000 outpaced inflation 64% of the time with average returns 5% greater than inflation.
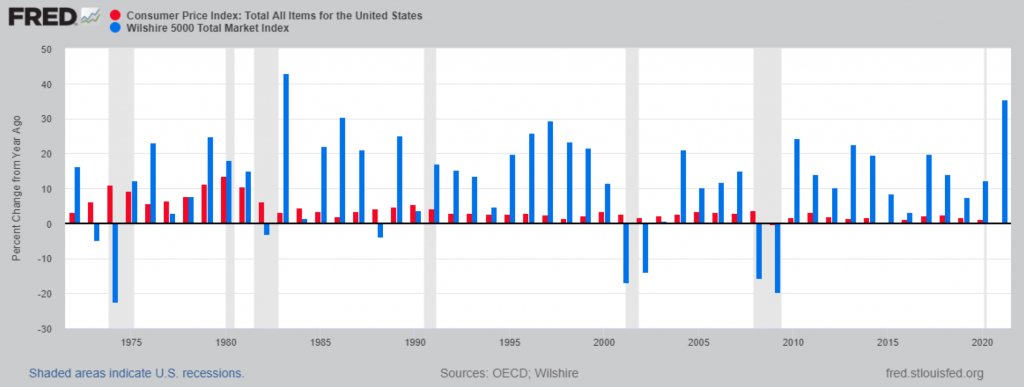
Chart 2: Federal Funds Rate and the Annual Percentage Change of Consumer Prices and the US Stock Market, 1972 – 2021
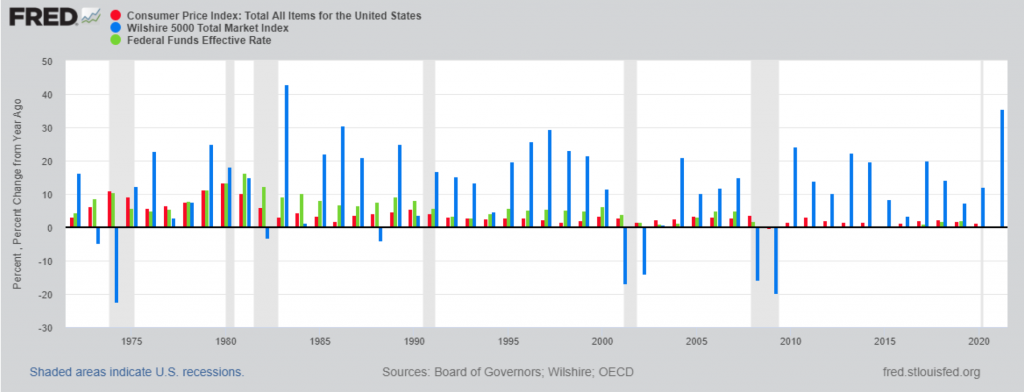
Chart 2 above shows interest rates as a green line in addition to inflation and stock market returns.
Over the past 50 years, we have had 21 years that interest rates have increased from the previous year. Of those 21 years, the Wilshire 5000 outpaced inflation 75% of the time.
Chart 3: Growth of Us Stocks compared to Consumer Inflation, 1972 – 2021
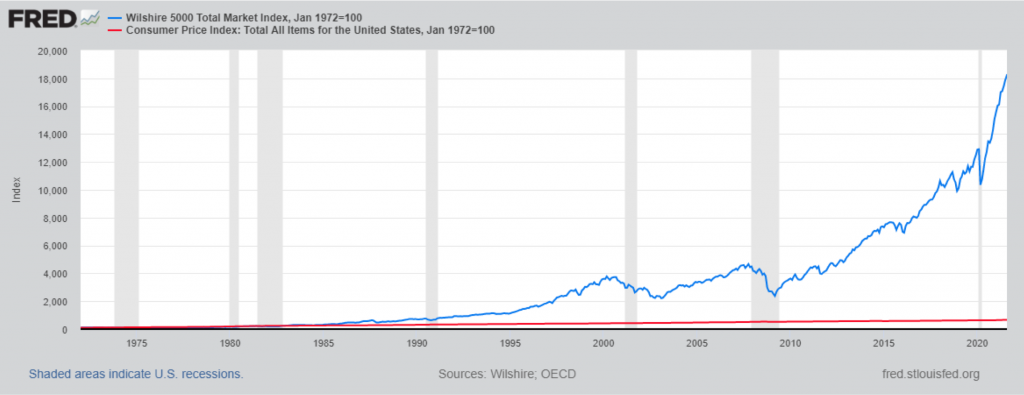
The growth of the Wilshire 5000 index compared to inflation can be easily seen in Chart 3 above.
When looking at the long-term growth of the Wilshire 5000 compared to the increase of prices due to inflation from 1972, we can see the growth of stocks is much greater. In fact, the Wilshire 5000 grew by a factor of 190 while inflation grew by a factor of 6 over the past 50 years.
Conclusion
While many in the financial media are linking rising inflation and any future rising interest rates with declining stock market returns, a look back in history does not find a conclusive link. In fact, stock market returns have outpaced inflation most periods whether interest rates are rising or not. When we use history as a guide, the tension being created in the media does not seem justified and seems meant to keep viewers tuned in.
There is risk when investing in the stock market but investors can reduce some of this risk with a valid and well thought out investment plan. By not trying to time markets based on media assumptions we are best served by “tuning out the noise” generated in the media.
¹ Wilshire 5000 is an index measuring the performance of all actively traded public US companies. It is not possible to invest directly in the Wilshire 5000 index.
² All charts and data retrieved from FRED, Federal Reserve Bank of St. Louis, https://fred.stlouisfed.org/.


Federal Funds Effective Rate [FEDFUNDS], Board of Governors of the Federal Reserve System (US), retrieved from FRED, Federal Reserve Bank of St. Louis; https://fred.stlouisfed.org/series/FEDFUNDS, November 11, 2021.

Wilshire 5000 Total Market Index [WILL5000IND], Wilshire Associates, retrieved from FRED, Federal Reserve Bank of St. Louis; https://fred.stlouisfed.org/series/WILL5000IND, November 11, 2021. The total market indexes are total market returns, which do include reinvested dividends. Copyright, 2016, Wilshire Associates Incorporated. Reprinted with permission. For more information about the various indexes, visit Wilshire Associates.


Consumer Price Index: Total All Items for the United States [CPALTT01USM661S], Organization for Economic Co-operation and Development, retrieved from FRED, Federal Reserve Bank of St. Louis; https://fred.stlouisfed.org/series/CPALTT01USM661S, November 11, 2021. Copyright, 2016, OECD. Reprinted with permission
